Home Tab – Overview
The Home tab is the primary dashboard of the ANT platform. It provides quick access to portfolio performance, trading tools, market discovery features, and actionable trading insights.
Within the Home tab, users can switch between five key sections:
- Investment
- Trading
- Screeners
- Option Chain
- Trading Ideas
Each section is designed to support a different stage of the trading and investing journey.
1. Investment
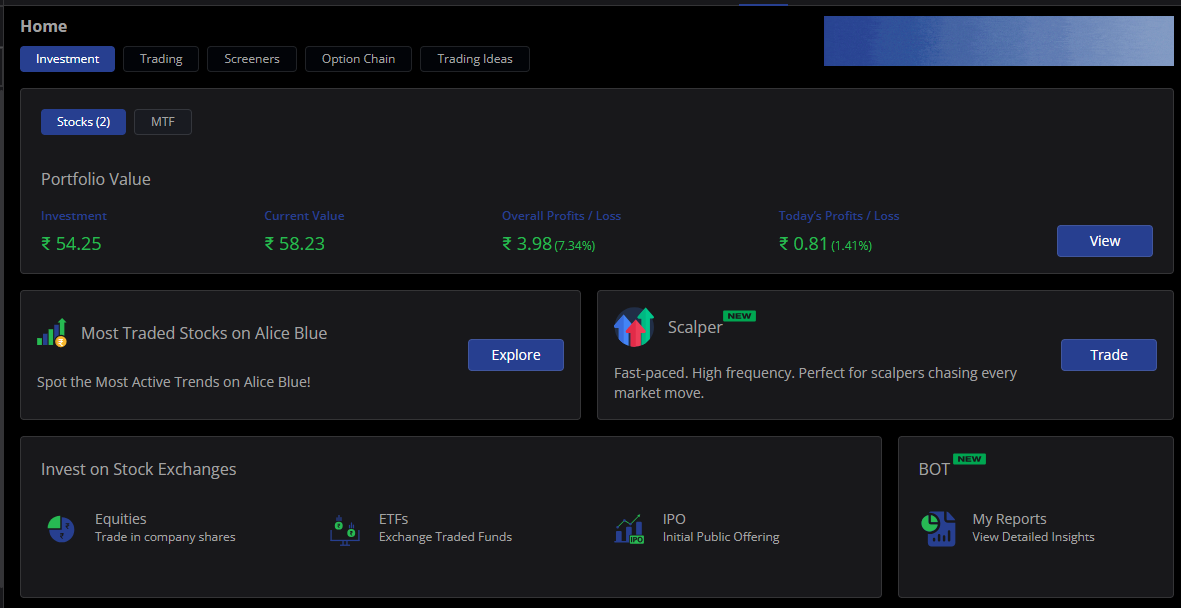
The Investment section gives users a consolidated view of their long-term investments and overall portfolio health.
Key Features
Displays Portfolio Value, including: - Investment amount - Current market value - Overall Profit/Loss - Today’s Profit/Loss
Quick access to investment products: - Equities – Buy and sell company shares - ETFs – Exchange Traded Funds - IPO – Apply for upcoming public issues - SGBs – Sovereign Gold Bonds
Shows Funds Overview: - Available for investing - Margin used - Opening balance - Quick Payin option
Use Case
Helps investors monitor portfolio performance and take investment actions without navigating to multiple pages.
2. Trading
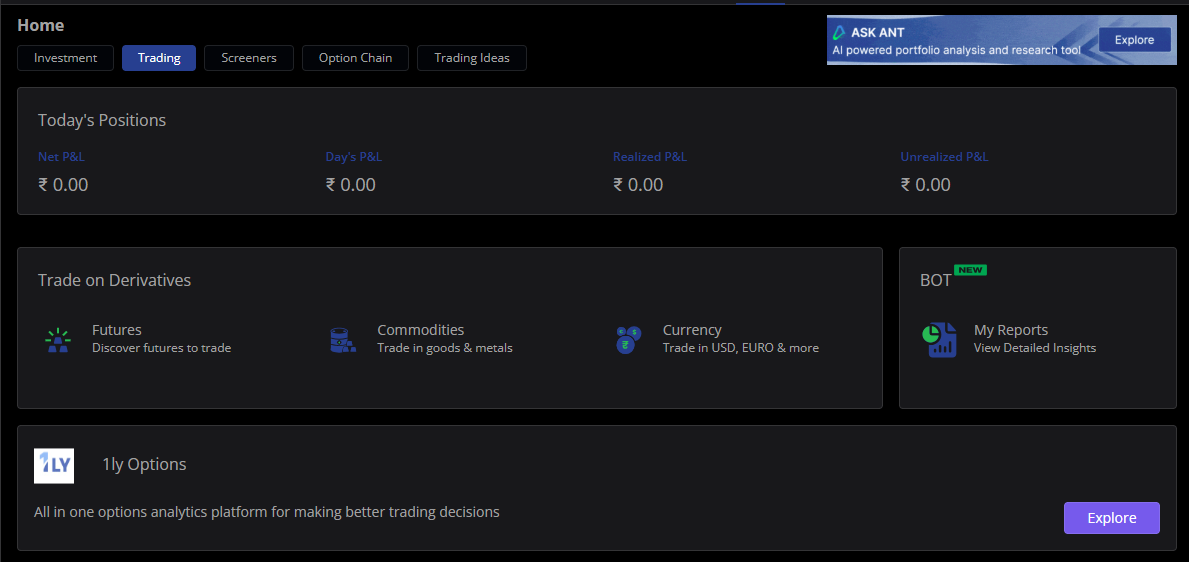
The Trading section is focused on active traders who trade intraday or derivatives.
Key Features
Displays Today’s Positions with: - Net P&L - Day’s P&L - Realized P&L - Unrealized P&L
Quick access to derivative trading: - Futures - Commodities - Currency
Shortcut to Reports for performance analysis
Use Case
Allows traders to track live positions and quickly enter derivative segments from a single screen.
3. Screeners
The Screeners section helps users discover trading opportunities using pre-defined market filters.
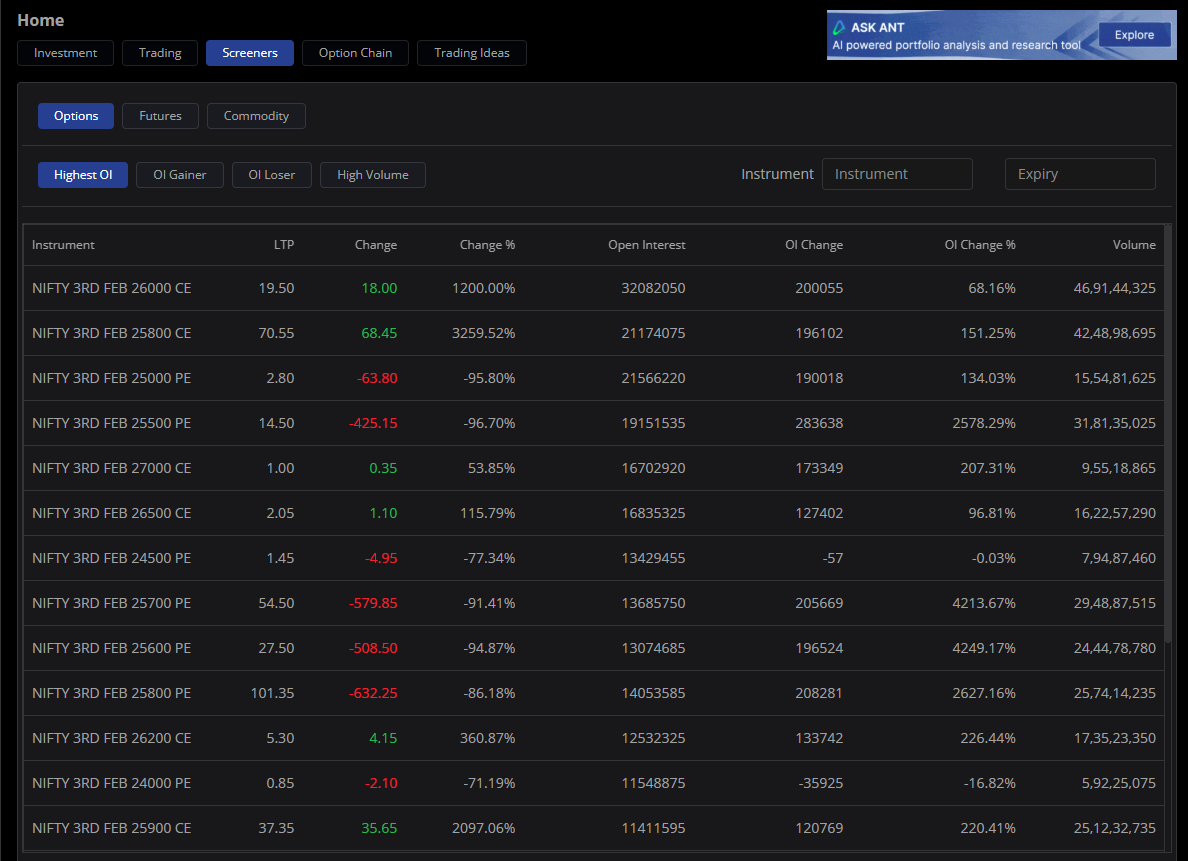
Available Screeners - Options - Futures - Commodity
Filtering Options - Highest Open Interest - OI Gainers - OI Losers - High Volume
Data Displayed - Instrument name - LTP (Last Traded Price) - Price change & percentage - Open Interest - OI change & OI change %
Use Case
Ideal for traders looking to identify momentum, unusual activity, or volume-based opportunities.
4. Option Chain
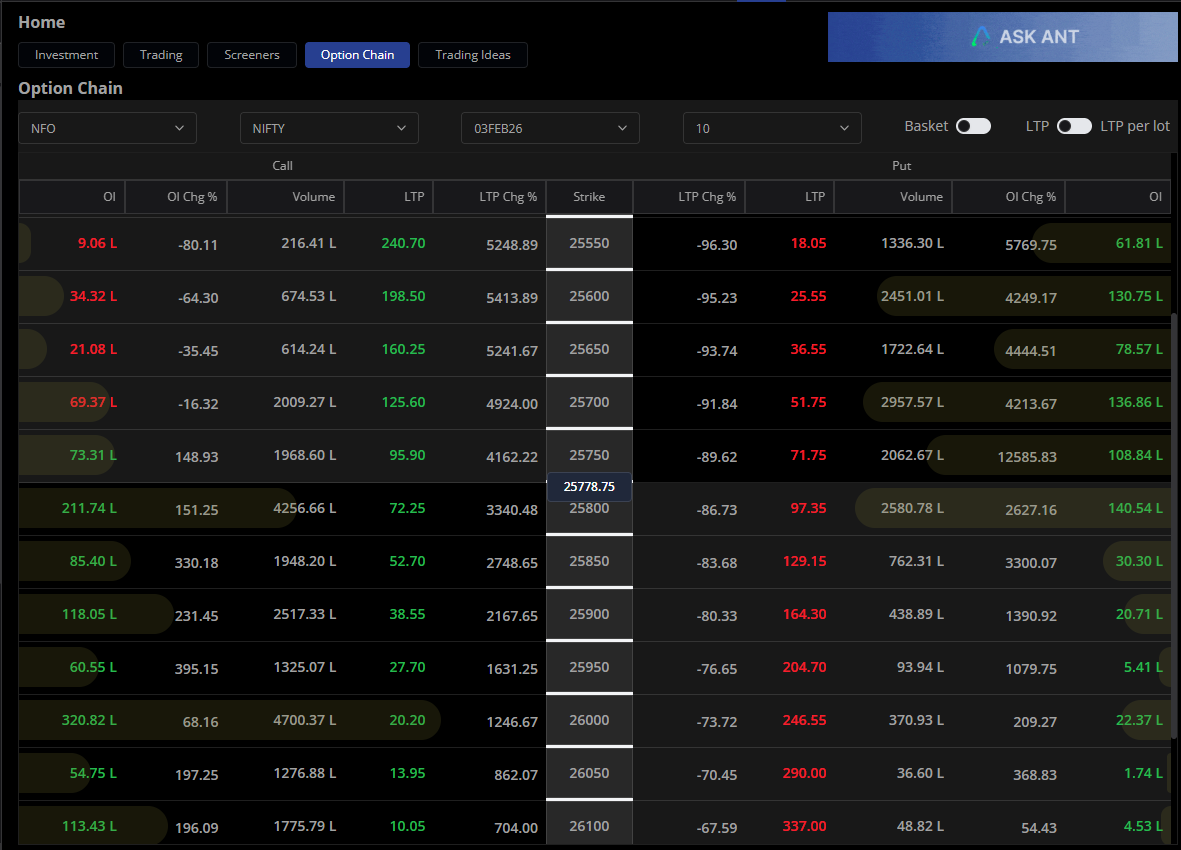
The Option Chain section provides a detailed view of call and put data for index and stock options.
Key Features
Select: - Exchange (NFO) - Index / Symbol (e.g., NIFTY) - Expiry date
Displays for both Calls and Puts: - Open Interest (OI) - OI Change % - Volume - LTP - LTP Change %
Clearly highlights the ATM (At-The-Money) strike price
Use Case
Helps options traders analyze market sentiment, identify support/resistance levels, and plan option strategies.
5. Trading Ideas
The Trading Ideas section provides system-generated and research-backed trade recommendations.
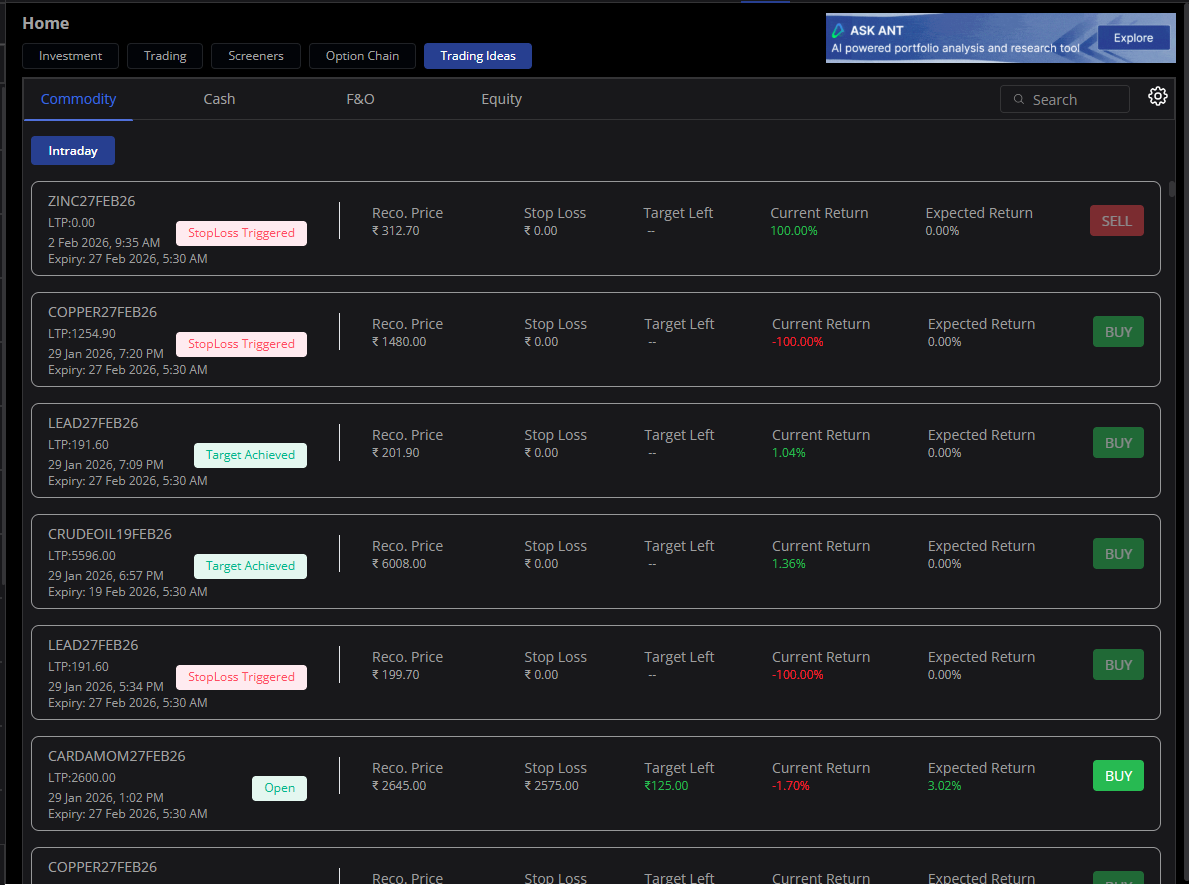
Segments Covered - Commodity - Cash - F&O - Equity
Information Shown - Instrument name - Recommended price - Stop loss - Target status (Target Achieved / Stop Loss Triggered) - Expiry details (for derivatives)
Use Case
Supports traders with ready-to-use ideas and reduces decision-making effort, especially for beginners and intermediate traders.